


Introduction:
If you are an aspirant willing to take an IELTS exam, but still not sure how to enhance your band score in IELTS Writing, then this blog is a quick fix for you. In this blog, you will discover the ins and outs of IELTS Writing Task 1 and the par excellence strategies that you should and should not employ to score 7+ bands in IELTS Writing.
How to plan your IELTS Writing Task 1?
Planning what to write is the biggest concern of many students aiming to take the IELTS exam. Organization in your write-up brings clarity and understanding of the topic presented. Follow the steps mentioned below to formulate your report.
- Analyze the type of graph: Have a look at the graph and understand its type.
- Allocate 20 minutes: Out of the two tasks in IELTS writing, Task 1 requires less time than Task 2. Keep an eye on the clock and spare NO MORE THAN 20 (5+15) minutes to Report Writing. 5 minutes for planning and 15 minutes to write what you have planned.
- Note the main features: Have a close look at the main features and list down the trends or fluctuations. Making a list of the highest or the lowest points will help you pen down the observations faster.
- Recall some linking vocabulary: Try to remember the vocabulary that can help you in framing the statements in a better manner.
- Identify the similarities and differences: See if there is any commonality or dissimilarity in the given graph. By doing this, you will get enough content to put forward.
Types of Graphs
It is quite vital to familiarize yourself with myriad types of charts/graphs. Here is the list to make your work easier;
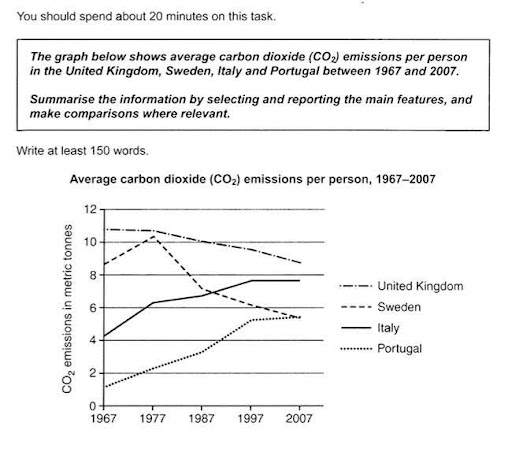
Line Graph:
In this question type, you will be given a graph with 2 or more lines. You are required to mention the information that is supplied to you.
Bar Graph:
This graph consists of different bars either in horizontal or vertical form. You can make comparisons wherever relevant.
The bar chart shows the factors that most affect work performance at a given company by age group.
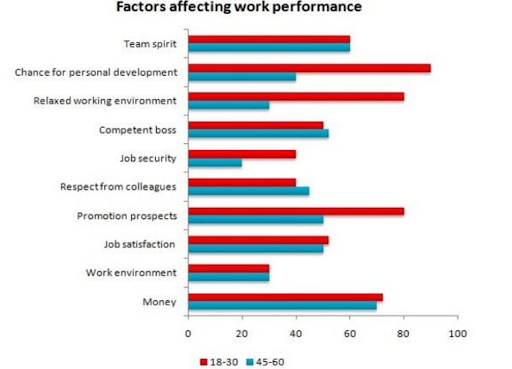
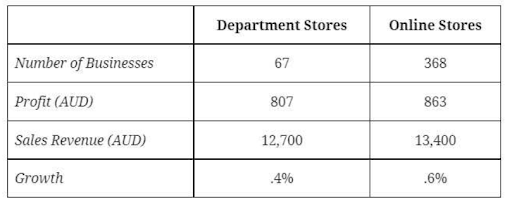
Table Chart:
This question reflects the data in a tabular format. This type of chart is considered to be the easiest as the comparisons are a cake walk to figure out.
The table gives information about the department and online stores in Australia in 2011. Summarise the information by selecting and reporting the main features, and make comparisons where relevant.
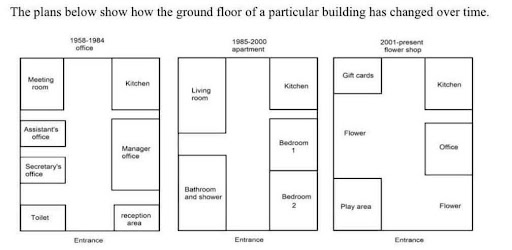
Map information
Maps generally describe the structure of any building, place, or area. You are supposed to write the visible differences that you see, which are given, for a particular time period.
The plans below show how the ground floor of a particular building has changed over time.
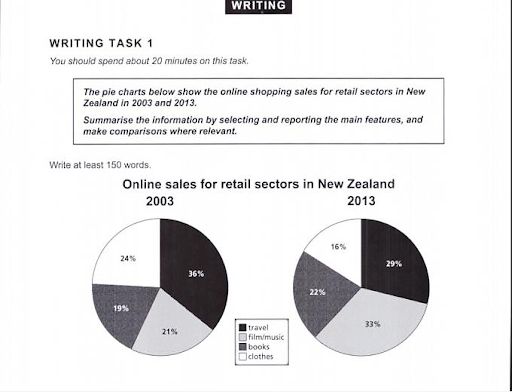
Pie Chart:
One or more pie charts will show you the information on the topic that you are expected to write about. No inclusion of ‘X axis or Y axis’ will be seen here in this question type.
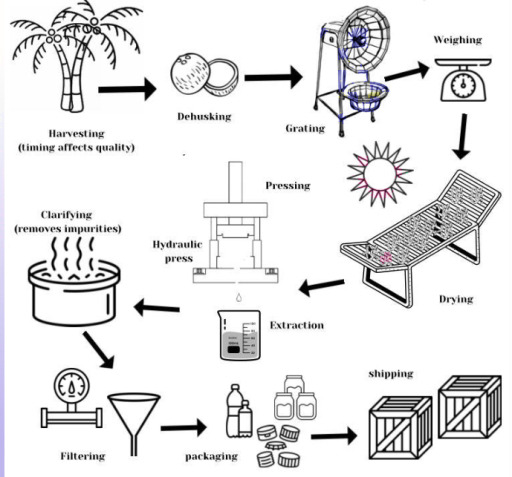
Process Diagram::
Such a question type contains a wide variety of different types of graphics. It could be a natural process, such as the water cycle, a manufacturing process, or a diagram of a system. You need to comprehend the process at every step and write accordingly.
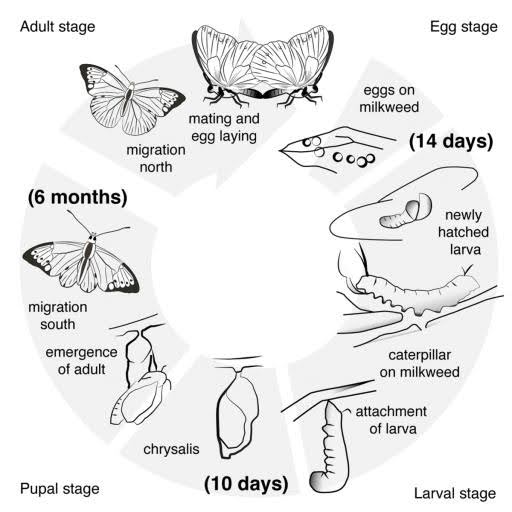
Life Cycle Diagram:
Here, the diagram reflects the life cycle of any item, an insect, animal, or so on, and you must provide a detailed report mentioning the sequence of events occurring. This type of question becomes easy for test takers to answer because they have to apply their knowledge only in drafting a structured report with all the main elements based on the given information, rather than thinking through the entire content.
Note that there can be combination of any of the two types of graphs. For example, you may see a bar graph with a table.
How to Structure Your Report?
It is very fundamental to learn the structure of writing a report to score the maximum in this task. When you write your IELTS Writing task 1 in a better constructed manner, it makes easy for the examiner to figure out the main elements in your task. Ensure to write 4 paragraphs in your report. Follow the below mentioned structure:
- Introduction paragraph: This paragraph must include a paraphrasing of the topic in your own words by using various synonyms or the voice of the statement. No repetition of words from the question should be done.
- Overview paragraph: In order to highlight the key factors of the graphs, you stand in need of drafting an overview. This may include some of the vital details, such as an extreme point of increase in percentage or a steep downfall.
- 2 Body paragraphs: Body paragraph 1 and body paragraph 2 must include all the information presented in the graph using a combination of various grammatical structures and making the optimal use of lexical resources.
4 paragraphs make your report an ideal one to score the highest bands for this task. Keep this structure in your mind, always.
What you MUST do?
Making yourself aware of the things to take into consideration before commencing on writing the task will assist you in limiting your chances of committing multiple errors. Do these things prior to writing your report:
- Divide your time: The overall 20 minutes of your IELTS Writing Task 1 should be further divided into 2 parts, i.e 5 minutes and 15 minutes. 5 minutes for planning what and how to write, remaining 15 minutes for writing the task with accuracy.
- Keep an eye on your word count: As the minimum words required for the fulfillment of task 1 is 150, you must also see that you write between the range of 150 and 200 words. 180-185 words are mostly considered perfect.
- Mention key features with all the other data: Your report will satisfy the evaluation criterion of ‘Task Response’ only when you have been able to justify the information given to you. Avoiding any part of the data may result in fewer bands.
- Learn vocabulary that can link with the graph type: Lexical resources play a sizeable role in Writing Task 1. Applying some simple yet informative vocabulary will improve the bands.
- Proofread your report: Proofreading your report will help you find your typical flaws/mistakes and save you from a reduction in your bands.
- Get your tasks assessed: The assessment of your writing task will help you in not committing the same mistakes again and again.
What you MUST NOT do?
After knowing certain things to be taken into account, being familiar with the don’ts is also equally essential. Below are the points you must NEVER DO:
- Exceeding the word limit: Writing too much also shows your ineffectiveness in finding the central factors to pen down. Do not draft the report of more than 200 words.
- Mismanagement of time: 20 minutes are enough to write on the data that has already been provided. Students tend to spend around 30 minutes on task 1, which is, actually, not at all necessary. Manage your time wisely.
- Mention key features with all the other data: Your report will satisfy the evaluation criterion of ‘Task Response’ only when you have been able to justify the information given to you. Avoiding any part of the data may result in fewer bands.
- Simply explaining in sentences: Figurative information is very influential and hence should be mentioned, always. Writing the report in sentence form may not impress the examiner much, but sentences with the inclusion of numbers are entertained more.
- Including your opinion: As it is a report writing, which has to be written on factual information, your opinion has no place here. Inserting your viewpoint may impact your band score.
Conclusion
Acing your IELTS Writing task 1 is actually a child’s play now as you are very well known about the dos and don’ts of this task. Furthermore, do not limit your access, take help of expert IELTS faculty who will assess your writing task and make your journey of scoring higher bands in IELTS writing easier.